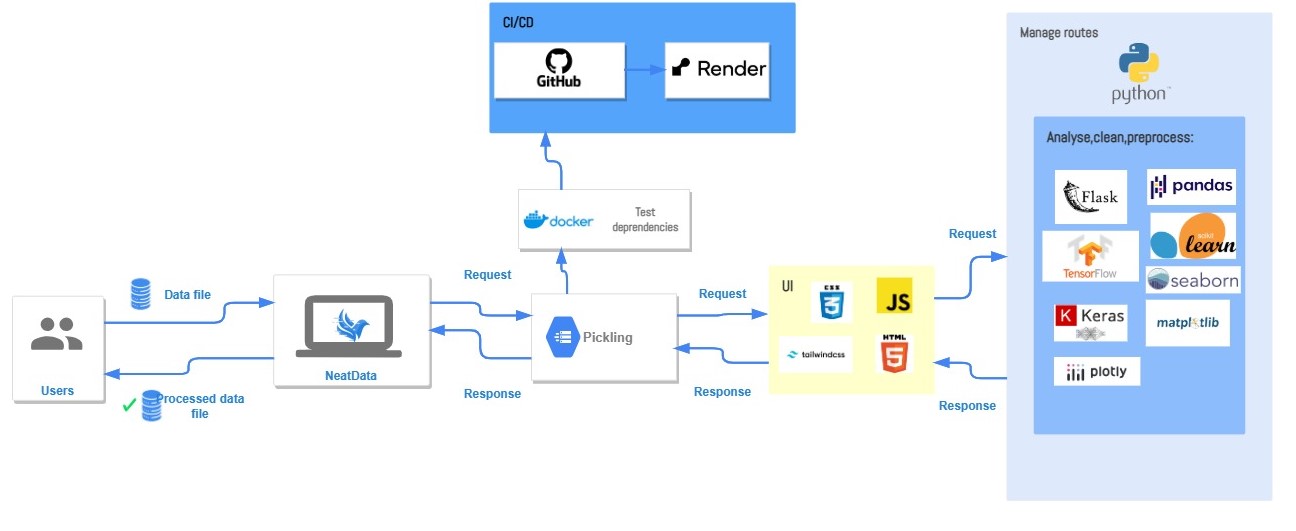
NeatData
NeatData automatically detects and fixes data quality issues so you can focus on analysis instead of cleaning.
NeatData automatically detects and fixes data quality issues so you can focus on analysis instead of cleaning.
Handle missing data efficiently with the right methods for better model performance.
Sample your data to improve training results and model accuracy.
Let NeatData help you choose the most suitable method to handle missing values in your data.
Convert your data between CSV, Excel, JSON, and Parquet formats without losing structure.
Easily encode categorical variables for machine learning models.
Identify and correct errors in your dataset to improve its quality and reliability.
Detect and manage outliers to ensure more accurate data analysis.
Reduce the number of input variables and optimize feature selection for better model performance.
Start by uploading your CSV, Excel, or JSON file. NeatData supports all common data formats with automatic format detection.
The system immediately scans your data structure and provides a quick overview of data quality issues.
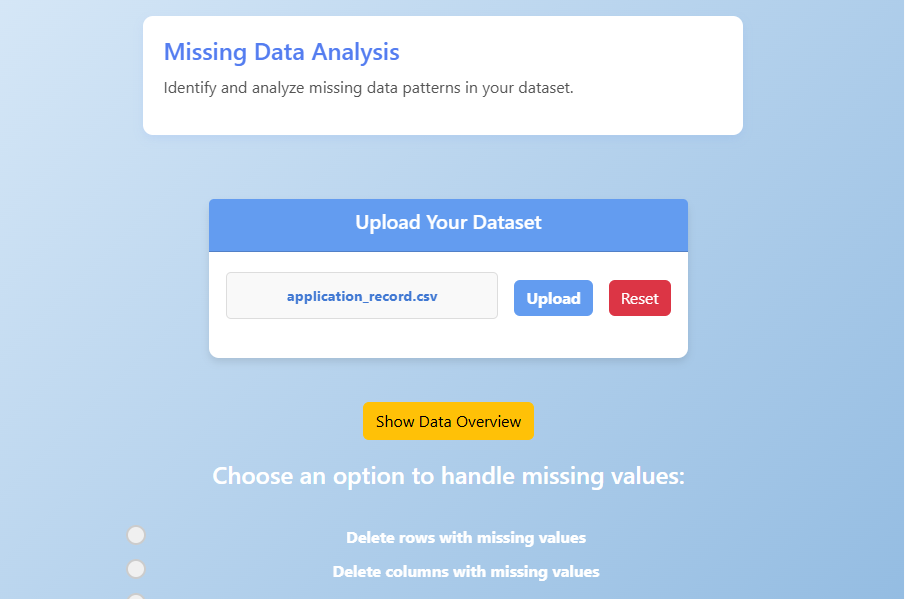
Simple drag-and-drop interface for data import
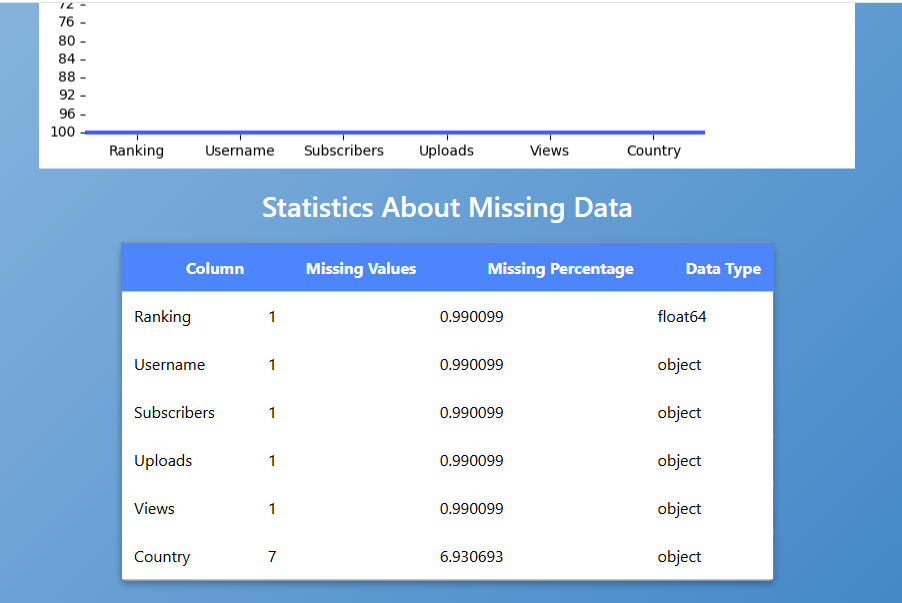
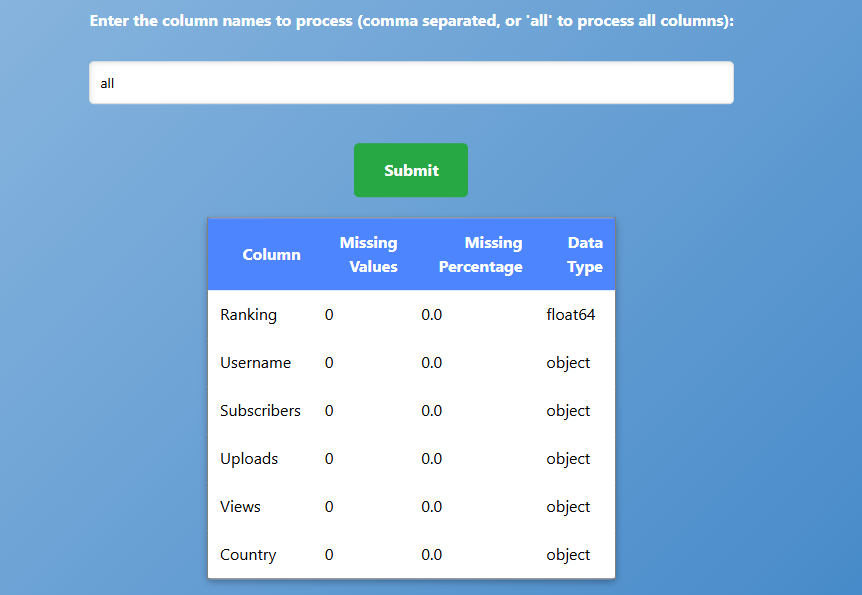
After import, NeatData presents a comprehensive overview of your dataset. The Data Quality Score gives you an immediate assessment.
Click on the "Show Data Overview" tab to see detailed statistics about null values in your dataset.

Interactive data overview with quality metrics
NeatData offers multiple ways to visualize missing data patterns. Choose between heatmaps or bar charts to understand the distribution of null values.
The visualization helps identify columns with excessive missing values that might need special treatment.
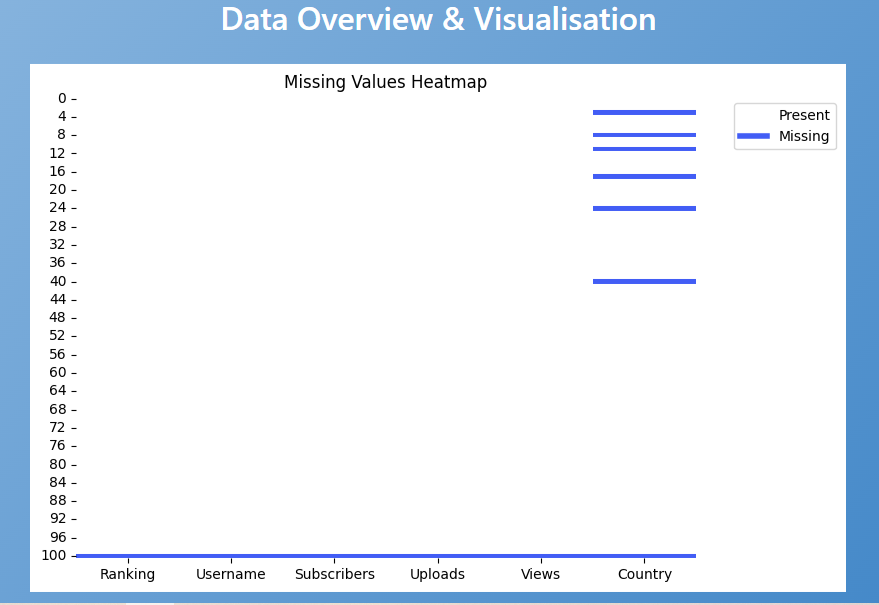
Heatmap visualization
Bar chart visualization
Choose from multiple handling strategies:
NeatData recommends the optimal approach based on your data characteristics.
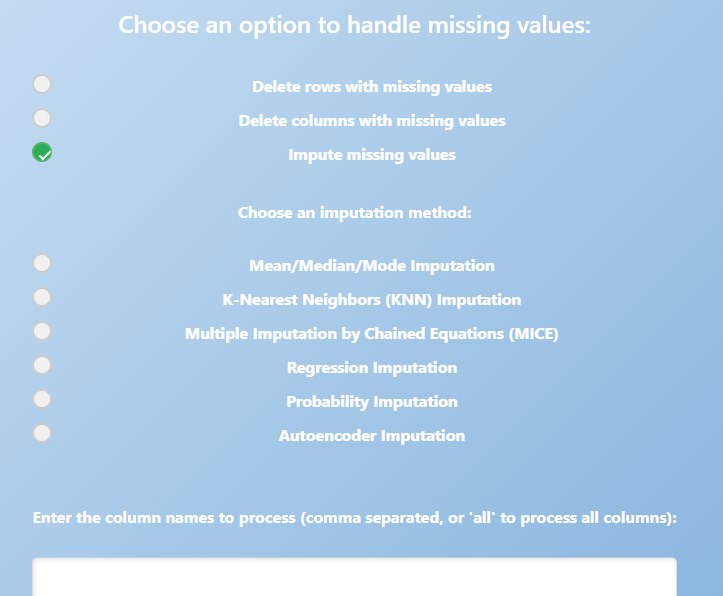
Comprehensive processing options
After processing, NeatData shows before/after comparisons of your dataset. Verify the changes and see the improvement in your Data Quality Score.
Export your cleaned data in any format, or save the processing pipeline to apply to future datasets.
Before/after comparison
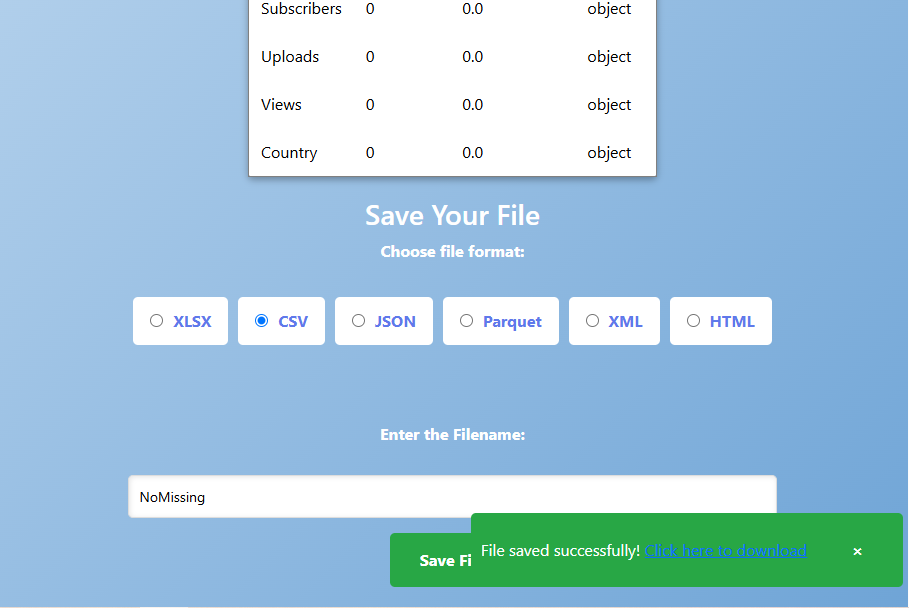
Multiple export formats
Join thousands of data professionals who trust NeatData for their data cleaning needs.
If you’d like to get in touch, feel free to send me a message.